


Auto insurance pricing is already moving beyond fixed assumptions. Over the last few years, models like Pay As You Go (PAYG) have shifted pricing closer to real usage by asking a simple question: how much does someone drive?
Pay How You Drive (PHYD) takes that one step further. Instead of focusing only on mileage, it looks at something more telling, how that mileage is actually driven.
At its core, PHYD is a behavior-based insurance model where premiums are influenced by real driving patterns captured through telematics. Rather than relying primarily on traditional rating factors like age, ZIP code, or historical proxies, insurers begin to incorporate observed driving behavior into pricing decisions.
According to research, insurers using behavioral pricing models can improve risk segmentation accuracy by up to 30%.
This changes the role of data in underwriting. Instead of estimating risk upfront and leaving it largely static, PHYD allows insurers to continuously refine their view of risk based on how a policyholder actually behaves on the road.
Understanding the Pay How You Drive Insurance
PHYD is a behavior-based pricing model.
Premiums are adjusted based on continuous assessment of driving quality, not just miles accumulated. The insurer collects granular telematics data, processes it through a behavioral scoring engine, and applies a score-derived modifier to the base premium.
The key distinction from PAYG is that PHYD is not an exposure correction. It is a risk quality correction.
How Pay How You Drive Insurance Works
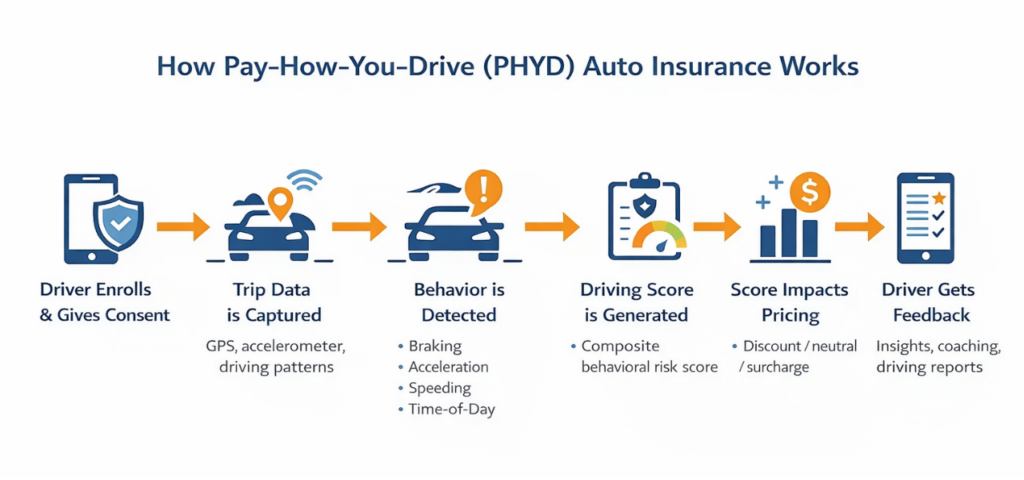
While the underlying technology can be complex, the customer and insurer journey typically follows a clear sequence:
- Enrollment and Consent: The policyholder opts into the program, agreeing to share telematics data through a mobile app, device, or connected vehicle system.
- Trip Data Collection: Each trip is recorded using sensors such as GPS and accelerometers, capturing movement, speed, and driving patterns.
- Behavioral Event Detection: The system identifies specific driving events, for example, hard braking, rapid acceleration, speeding, or late-night driving.
- Score Generation: These events are processed into a composite driving score, reflecting the overall risk profile of the driver.
- Pricing Adjustment: The score is translated into a pricing outcome, typically a discount, neutral adjustment, or surcharge, applied at renewal or, in some cases, during the policy term.
- Feedback Loop: Drivers receive insights or summaries of their driving behavior, creating a continuous feedback cycle between behavior and pricing.
This structured flow is what differentiates PHYD from simpler usage-based models. It is not just tracking activity, it is interpreting behavior and linking it directly to risk.
Behavioral Signals That Drive the Score in PHYD
The variables most predictive of loss frequency and severity are:
- Hard braking events: the strongest single predictor of loss frequency
- Rapid acceleration: correlated with aggressive driving patterns
- Speeding above posted limits: primary severity driver
- Time-of-day driving concentration: elevated risk in nighttime hours
- Phone distraction proxies: screen-state + motion fusion signals
Pricing Architecture & Behavioral Scoring for Pay How You Drive Auto Insurance
If PHYD changes how risk is observed, pricing architecture is where that insight turns into measurable financial impact.
At a structural level, PHYD does not replace traditional ratings. Instead, it layers behavioral intelligence on top of it, allowing insurers to refine pricing based on how risk is expressed over time, not just how it is assumed at policy inception.
This creates a dual-layer model where traditional underwriting establishes the baseline, and behavioral scoring adjusts that baseline dynamically.
Types of Pricing Structure in PHYD
Most PHYD programs follow a consistent structure:
- Base Premium: Calculated using traditional rating variables such as vehicle, coverage, territory, and driver history.
- Behavioral Modifier: A percentage-based adjustment applied on top of the base premium, reflecting observed driving quality over a defined scoring window.
In practice, this means two drivers with identical starting profiles may diverge over time based on how they actually drive. Pricing becomes less about assumed risk and more about continuously observed behavior.
Discount vs. Surcharge Design
The pricing design in PHYD is not just about adjustment, it’s about how risk is introduced into the product over time.
Most insurers begin with a discount-only model, where safer driving leads to lower premiums, but risky behavior does not immediately result in penalties. This reduces customer resistance and simplifies regulatory approval.
As data maturity improves, insurers shift toward bidirectional pricing, introducing both discounts and surcharges. This allows pricing to better reflect actual risk and helps maintain loss ratio discipline, especially for consistently high-risk drivers.
In-Term vs. Renewal Adjustment
Another core design choice is when behavioral data impacts pricing.
In renewal-based models, pricing is updated at the start of each policy term using past driving data. This approach is stable and easier to operate but slower to reflect behavior changes.
In in-term models, pricing adjusts during the policy period based on ongoing data. This improves accuracy but requires real-time billing capability and clear communication to avoid customer confusion.
Behavioral Variables & Pricing Impact on Insurance Premiums
Behavioral scoring is built on telematics-derived variables that demonstrate measurable relationships with loss outcomes. Each variable must be carefully selected, validated, and weighted based on its predictive strength.
| Variable | Measurement Method | Pricing Impact | Primary Data Source |
|---|---|---|---|
| Hard braking | Accelerometer – G-force threshold breach | High – strong loss frequency predictor | Mobile SDK / OBD-II |
| Rapid acceleration | Accelerometer + GPS speed change | Moderate-High | Mobile SDK / OBD-II |
| Speeding | GPS speed vs. posted limits (map-integrated) | High – linked to severity and frequency | GPS + map layer |
| Time-of-day driving | Trip timestamp segmentation (e.g., night driving) | Moderate -elevated risk periods | Mobile app / OEM feed |
| Phone distraction | Device sensor + screen interaction patterns | High – proxy for distracted driving | Mobile SDK |
| Cornering / handling | Gyroscope + accelerometer data | Moderate | Mobile SDK / OBD-II |
| Behavioral consistency | Pattern stability across trips | Low–Moderate | Scoring engine |
Not all variables carry equal weight. Insurers typically prioritize those with stable and statistically credible relationships to loss frequency, while continuously evaluating emerging signals such as distraction.
Score Translation to Pricing Bands
Once behavioral data is captured, it must be translated into a usable pricing signal.
Most PHYD programs aggregate individual variables into a normalized composite score, often on a 0-100 scale. This score is then mapped into pricing bands such as ‘Excellent’, ‘Good’, ‘Fair’ & ‘High-Risk’.
These bands determine the final premium adjustment applied to the policy.
Typical structures include:
- Discount Corridor: ~5% to 30% reduction for better-than-average drivers
- Surcharge Bands: Applied to consistently high-risk behavioral profiles, where actuarially supported and regulatorily approved
Transparency vs. Black-Box Scoring
A critical design choice lies in how scores are presented:
- Transparent Models: Clearly indicate which behaviors influenced the score. This improves customer understanding, supports coaching, and reduces disputes.
- Black-Box Models: Rely on opaque machine learning outputs with limited explainability. While potentially more predictive, they introduce challenges in customer communication and are increasingly scrutinized by regulators.
In practice, most insurers move toward explainable scoring frameworks, balancing predictive accuracy with regulatory defensibility and customer trust.
Actuarial Validation Layer
For PHYD to function as a rating mechanism, not just a data feature & behavioral variables must meet actuarial standards.
Each variable entering the rating engine must demonstrate:
- A statistically credible relationship with loss frequency and, where relevant, loss severity.
- Sufficient data maturity, typically requiring 18-24 months of matched telematics and claims data.
- Stability across different driver segments and geographies.
Interaction Effects & Fairness Testing
Behavioral variables do not exist in isolation. They must be evaluated in the context of traditional rating factors.
For example:
- A speeding variable may correlate strongly with certain territories.
- Time-of-day driving may align with specific demographic patterns.
These relationships can introduce:
- Redundancy in rating factors
- Potential proxy effects for protected classes
As a result, actuarial validation must include:
- Interaction testing with existing rating variables
- Disparate impact analysis
- Documentation for regulatory filings
Operational Consideration: Pricing Stability
Beyond statistical accuracy, PHYD pricing models must also account for customer experience and retention.
Highly volatile pricing, driven by short-term behavioral fluctuations, can create confusion and dissatisfaction. Most insurers address this by:
- Using rolling averages or smoothing techniques
- Applying minimum data thresholds before score updates
- Limiting the frequency of pricing changes
This ensures that pricing remains both responsive and stable, balancing actuarial precision with real-world usability.
Technology & Data Infrastructure Required for Pay How You Drive Insurance Model
PHYD is not just a pricing model, it is a data-driven operating framework. Every pricing decision depends on how accurately driving behavior is captured, processed, and translated into risk signals.
In practice, successful PHYD programs are built on a layered architecture, where each layer plays a critical role in ensuring that raw telematics data becomes reliable, explainable, and usable for pricing.
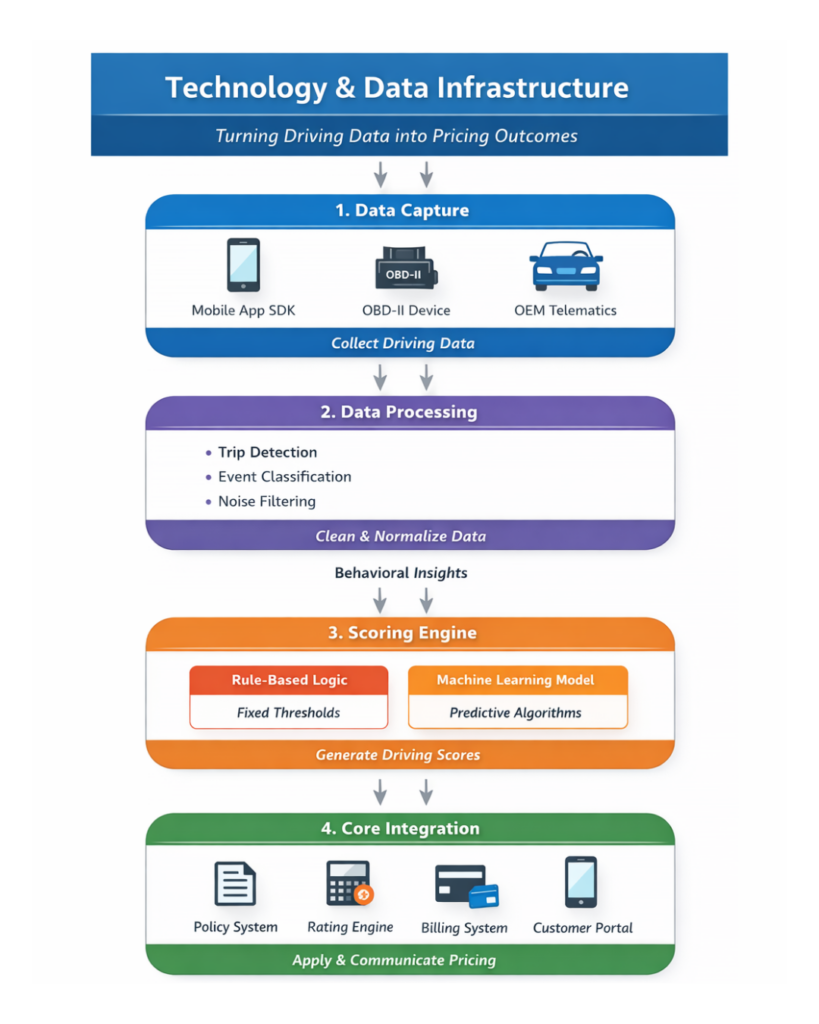
1. Data Capture Layer
The data capture layer defines what behavioral signals are available to the insurer. Each collection method comes with its own trade-offs between accuracy, cost, and scalability.
A. Mobile Application SDK
- Highest deployment flexibility, no additional hardware required.
- Requires explicit customer consent, battery optimization, and platform calibration (iOS vs. Android behavior differs).
- Captures inputs such as GPS, accelerometer, gyroscope, and screen interaction.
- Supports distraction detection through device usage patterns.
In most cases, this is the default starting point for PHYD programs due to ease of rollout and scalability.
B. OBD-II Dongle
- Provides consistent data quality through vehicle diagnostics (CAN bus integration).
- Strong signal accuracy for acceleration and braking events.
- Requires operational workflows for device shipping, activation, and returns.
- Limited capability for detecting phone distraction.
Suitable for programs prioritizing data precision over convenience, but with higher operational overhead.
C. OEM Embedded Telematics
- Most accurate and consistent data, as sensors are factory-installed.
- No additional effort required from the driver once enabled.
- Limited to newer connected vehicles.
- Data access depends on OEM partnerships and licensing agreements.
Increasingly important as connected vehicle adoption grows, especially for long-term strategic PHYD models.
2. Processing Layer
Raw telematics data cannot be used directly. The processing layer ensures that collected data accurately reflects real driving behavior.
This layer performs three critical functions:
- Trip Detection: Identifies the start and end of journeys, while filtering out stationary periods and non-driving movement.
- Event Classification: Categorizes events such as hard braking, speeding, or phone usage based on calibrated thresholds.
- Noise Filtering: Removes false positives caused by speed bumps, signal loss, or sensor inconsistencies.
Data quality at this stage directly impacts everything downstream. If trips are misclassified or thresholds are poorly calibrated, the behavioral signal becomes unreliable, affecting both scoring accuracy and pricing outcomes.
Because of this, the processing layer requires continuous monitoring and calibration, not just a one-time setup.
3. Scoring Engine
Once data is processed, it is translated into behavioral risk insights through the scoring engine. This is where insurers define how driving behavior influences pricing.
Rule-Based Scoring
- Uses predefined thresholds (e.g., braking beyond a certain G-force classified as harsh braking).
- Easier to implement and explain.
- Preferred in early-stage programs and regulatory filings.
Best suited for transparency, speed to market, and compliance clarity
Machine Learning Models
- Learn patterns from historical driving and claims data.
- Capture non-linear relationships between behavioral variables.
- Continuously refine scoring logic as more data becomes available.
Require:
- Larger datasets
- Model validation processes
- Explainability frameworks for regulatory acceptance
Model Governance Requirements
Regardless of scoring approach, governance is critical.
Key requirements include:
- Defined model retraining schedules (e.g., quarterly or based on meaningful data growth).
- Holdout testing against actual loss outcomes to validate predictive performance.
- Fairness testing to detect bias across demographic proxies.
- Version control and audit trails for regulatory review and filing support.
Without governance, even highly predictive models become difficult to justify in a regulated environment.
4. Core Integration Layer
Behavioral insights only create value when they are connected to core insurance systems.
This layer integrates telematics outputs into:
- Policy Administration System (PAS) → applies behavioral modifiers.
- Rating Engine → calculates final premiums.
- Billing Systems → supports renewal or in-term adjustments.
- Customer Interfaces (apps/portals) → provide feedback and transparency.
Without this integration, PHYD remains a disconnected data initiative rather than a functioning insurance product.
Why This Architecture Matters
Each layer builds on the previous one:
Data Capture → Processing → Scoring → Pricing Integration
A weakness in any layer, whether poor data quality, incorrect event classification, or weak integration can directly impact:
- Pricing accuracy
- Customer trust
- Regulatory compliance
For insurers, the goal is not simply to collect telematics data but to create a system where Behavior → Insight → Pricing → Feedback operates as a continuous, reliable loop.
Related Read: Top 7 Usage-Based Insurance Trends in the USA & How Auto Insurers Can Make the Shift
How Underwriting Changes in PHYD Auto Insurance
PHYD changes underwriting from a static, point-in-time assessment into a continuous, behavior-informed process.
In traditional auto insurance, underwriting decisions are made at policy inception using proxy variables, age, location, vehicle type, and prior history. In PHYD, these still matter, but they are no longer the full picture.
Risk is no longer just predicted upfront, it is observed and updated over time.
1. Shift from Static to Dynamic Risk Assessment
In a PHYD model, underwriting does not end at bind. Instead, it evolves throughout the policy lifecycle.
This creates two layers of risk evaluation:
- Initial Risk Selection: Based on traditional underwriting variables at quote and bind.
- Ongoing Behavioral Validation: Based on how the insured actually drives after the policy becomes active.
This shift allows insurers to move closer to true risk alignment, where pricing and underwriting decisions reflect real-world exposure rather than assumptions.
2. Role of Telematics in Risk Segmentation
Behavioral data introduces a new dimension to segmentation.
Instead of grouping drivers only by demographic or historical proxies, insurers can segment based on:
- Driving smoothness (braking, acceleration patterns)
- Exposure context (time of day, trip patterns)
- Distraction indicators (device interaction while driving)
- Behavioral consistency over time
This enables more granular classification, where two drivers with similar traditional profiles can be placed into different risk tiers based on observed behavior.
3. Rules, Triggers, and Data Credibility for Underwriting
Many PHYD programs define clear underwriting triggers tied to behavioral signals. For example, consistently high-risk scores may prompt review, while improving scores may support better pricing treatment.
At the same time, insurers need to decide when behavioral data is credible enough to act on. Limited trip volume, incomplete data, or device inconsistency can distort underwriting decisions. That is why most programs set minimum credibility thresholds before telematics data influences underwriting action.
4. How to Manage Adverse Selection and Operational Balance
Because many PHYD programs begin as opt-in offerings, they can attract safer drivers first, creating participation bias in early results. Insurers often manage this by comparing telematics and non-telematics cohorts separately and keeping behavioral underwriting aligned with pricing and product rules.
The practical challenge is balance. Too many triggers and exceptions can make underwriting difficult to manage. Most insurers start with a small set of high-value behavioral rules and expand as data quality and operational confidence improve.
How Pay How You Drive Changes Claims Management
PHYD does not just impact pricing, it also changes how claims are validated, investigated, and resolved. According to a Deloitte study, telematics-supported claims can reduce fraud-related losses by 20–40%.
Telematics data introduces a new layer of evidence that helps insurers move from post-loss reconstruction to data-supported verification.
1. FNOL & Incident Context
At the time of First Notice of Loss (FNOL), telematics data can provide immediate context such as:
- Trip timing and location
- Speed and movement patterns before impact
- Driving conditions (e.g., time of day)
This allows insurers to triage claims faster and prioritize cases based on severity and complexity.
2. Event Validation & Liability Support
Behavioral and trip data can help validate whether:
- A trip was active at the time of loss
- The vehicle was in motion or stationary
- Driving behavior aligned with reported events
For example, braking patterns or sudden deceleration signals can support impact confirmation, while speed data can assist in liability assessment.
This does not replace investigation, but it adds an objective reference point.
3. Fraud Detection & Dispute Reduction
PHYD introduces structured data that can reduce ambiguity in claims.
It can help identify:
- Mismatches between reported and actual trip data
- Suspicious timing or location inconsistencies
- Repeated behavioral patterns linked to higher-risk claims
This improves fraud detection while also reducing unnecessary disputes in legitimate cases.
4. Claims Segmentation & Handling
With behavioral insights, insurers can better segment claims:
- Low-risk, well-documented incidents → faster processing
- High-risk or inconsistent cases → deeper investigation
This supports more efficient allocation of adjuster effort and improves overall claims cycle time.
Regulatory & Compliance Considerations Before Launching
PHYD is not just a pricing model, it is a regulatory and governance exercise from the start.
Because behavioral data affects premium, insurers must ensure that data collection, scoring logic, and pricing adjustments are all filed, explainable, and defensible under state rules.
1. Filing & Rating Approval
Behavioral factors used in pricing usually need actuarial support before they can be filed and approved. Insurers must show that the variables have a credible relationship to loss outcomes and clearly define how scores affect premium.
In stricter states, regulators may prefer discount-only structures first and may push back on complex or opaque scoring models.
2. Transparency, Privacy & Fairness
Insurers also need to explain:
- what data is collected
- how it affects pricing
- why a driver received a given score or adjustment
This makes explainable scoring more practical than black-box models.
At the same time, telematics programs must align with customer consent, privacy disclosures, and data retention rules. Behavioral variables should also be tested for disparate impact, proxy bias, and state-specific non-discrimination requirements.
3. Audit Readiness & State Variation
PHYD programs need clear audit trails, version control, and documentation for filings, objections, and model changes. Since regulatory expectations differ by state, rollout usually needs to happen state by state, not as a single national launch.
At its core, compliance in PHYD is about keeping behavior-based pricing fair, transparent, and regulator-ready.
Customer Target & Retention Strategy for Pay How You Drive Insurance
1. Target Segments
PHYD usually attracts drivers who believe they drive better than average and are open to sharing data in return for pricing benefits.
Common target segments include:
- Young drivers (18-26): often face higher base premiums and have more to gain from strong behavioral scores.
- Digitally engaged customers: more comfortable with app-based tracking and feedback.
- Safety-conscious drivers: more likely to respond well to behavior-based pricing
- Multi-vehicle households: offer a larger premium base and broader driving data over time.
2. Acquisition & Channel Enablement
At acquisition, the value proposition needs to be simple and concrete. Leading with behavioral language alone is usually less effective than leading with clear pricing benefits.
Approaches that work well include:
- Savings calculators to show possible discount ranges
- Agent enablement so agents can explain scoring, handle privacy questions, and set realistic expectations
- Clear digital messaging that frames PHYD as fairer pricing and driver control, not surveillance
Confusing program communication at enrollment is one of the biggest reasons customers drop out early.
3. Engagement Architecture
PHYD works best when score feedback becomes part of the customer experience, not just a hidden pricing input.
Strong programs usually offer:
- Trip or score dashboards
- Behavioral trend summaries over time
- Simple coaching insights
- Milestones or streak-based engagement features
The goal is to help customers feel they are improving, not just being monitored.
4. Retention Risks
Three common issues can drive churn in PHYD programs:
- Privacy fatigue – customers become uncomfortable with ongoing data collection.
- Score disputes – customers feel trips were misclassified or scoring was unfair.
- Surcharge churn – customers expecting discounts may leave if they receive a higher premium instead.
According to Capgemini research, around 40% of consumers cite data privacy as the biggest barrier to telematics adoption.
These risks are usually managed through clear communication, transparent scoring, defined dispute processes, and practical improvement pathways for customers near higher-risk bands.
Difference Between Pay-As-You-Need vs Pay-As-You-Go vs Pay-How-You Drive Insurance
To understand where PHYD fits, it helps to look at how it builds on earlier on-demand models:
- Pay As You Need (PAYN): Pricing is based on when coverage is active. It is primarily time-based and operational in nature.
- Pay As You Go (PAYG): Pricing is based on how much a driver uses the vehicle, typically measured in miles. It improves exposure accuracy but treats most miles similarly.
- Pay How You Drive (PHYD): Pricing is based on how well the vehicle is driven. It introduces behavioral scoring, allowing insurers to distinguish between drivers with similar usage but different risk profiles.
| Dimension | PAYN | PAYG | PHYD | Why It Matters |
|---|---|---|---|---|
| Pricing Basis | Time / session | Mileage | Behavior | PHYD prices risk quality, not just exposure volume |
| Data Required | On/off timestamps | GPS odometry | Full telematics stream | Sensor depth drives scoring accuracy |
| Underwriting Value | Exposure timing | Exposure volume | Risk selection + segmentation | PHYD targets both loss frequency and severity |
| Pricing Complexity | Low | Moderate | High | Scoring model + actuarial validation required |
| Regulatory Friction | Moderate | Moderate | High | Behavioral factors need state-level actuarial justification |
| Customer Engagement | Low | Low–Moderate | High | Score dashboards enable active behavior coaching |
| Technology Lift | Low | Moderate | Significant | Scoring engine + PAS integration mandatory |
Related Read: What Is Pay-As-You-Need Auto Insurance?
Related Read: What Is Pay-As-You-Go Auto Insurance?
Conclusion
PHYD is not just a telematics feature, it reflects a shift toward behaviour-driven insurance, where pricing and risk are continuously aligned with real-world driving.
The challenge is not defining the model but executing it end-to-end. PHYD touches pricing, underwriting, data infrastructure, customer experience, and compliance. If these elements are not aligned, the program risks becoming fragmented rather than scalable.
Successful insurers approach PHYD as a strategic transformation, not just a product add-on.
This is where insurance strategic consultant like Practo Insura help insurers design, implement, and scale PHYD programs across product strategy, pricing, infrastructure, and go-to-market execution.
As the industry evolves, PHYD is becoming less optional and more foundational. The real advantage lies in how effectively insurers can operate it.
We specialize in developing innovative Property & Casualty (P&C) insurance software solutions, leveraging over 8 years of InsurTech expertise to simplify insurance operations and enhance efficiency.
Share Article via


Subscribe to our insights newsletter
Related Blog Posts
Insurance Underwriting Automation: Implementation Guide...
 12 Jun, 2026
Most P&C underwriters did not join the industry to chase...
Read More
Why Claims Data Matters in...
03 Jun, 2026
Claims data has traditionally been treated as a record of...
Read More
What Is Subscription Auto Insurance...
15 Apr, 2026
Auto insurance was designed for a market built on long-term...
Read More